Collection of free jQuery chart and graph examples and plugins
Welcome to our collection of jQuery code examples! In this carefully curated compilation, we have gathered a wide array of code snippets that demonstrate the power and versatility of the jQuery library.
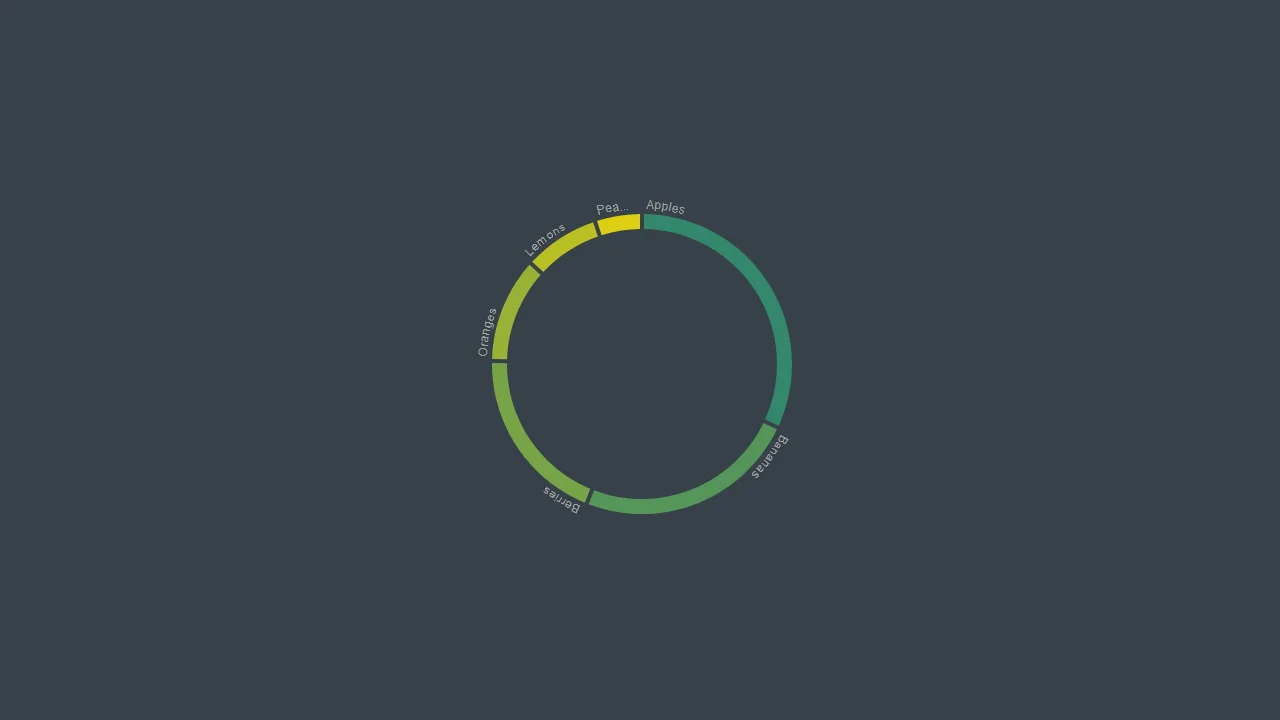

Donut in 2D : Chart Gallery
Ancoor | November 4, 2020
HTML / CSS / JS
About a code
A variation of the pie chart, the doughnut 2D chart has a blank space at the center to show useful information about the data being plotted.
Chrome, Edge, Firefox, Opera, Safari
yes
fusioncharts.js, fusioncharts.theme.fusion.js, fusioncharts.jqueryplugin.js
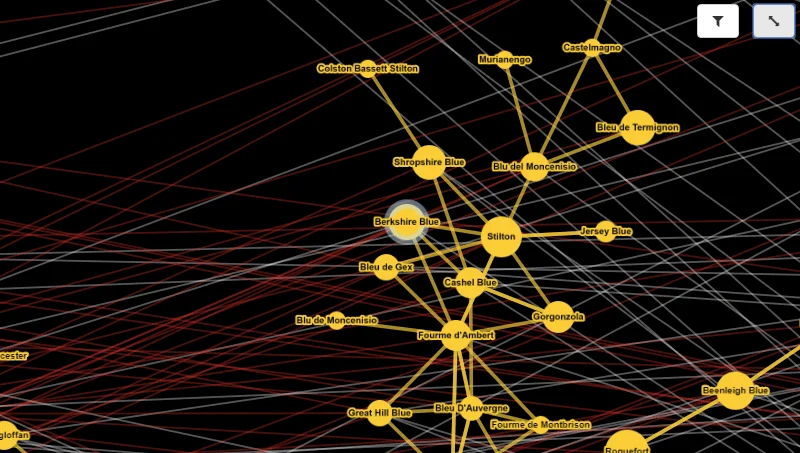
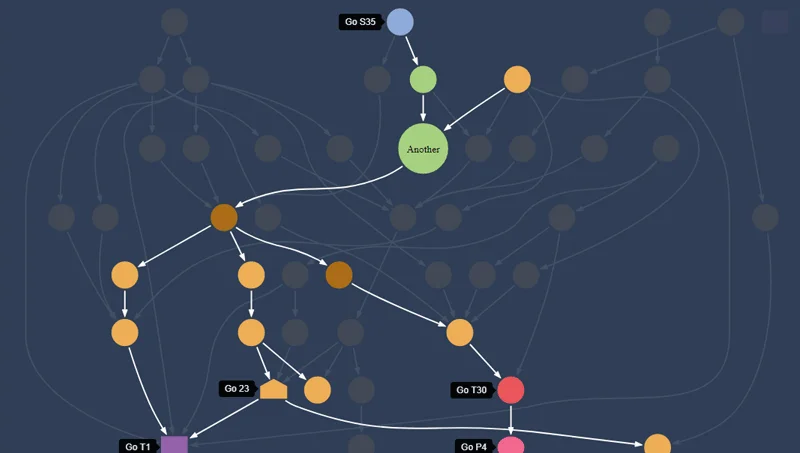
Cytoscape.js
Cytoscope | August 24, 2011
3801 stars200 watchers
About a code
Cytoscape.js is a fully featured graph theory library. Do you need to model and/or visualise relational data, like biological data or social networks? If so, Cytoscape.js is just what you need.
Cytoscape.js contains a graph theory model and an optional renderer to display interactive graphs. This library was designed to make it as easy as possible for programmers and scientists to use graph theory in their apps, whether it's for server-side analysis in a Node.js app or for a rich user interface.
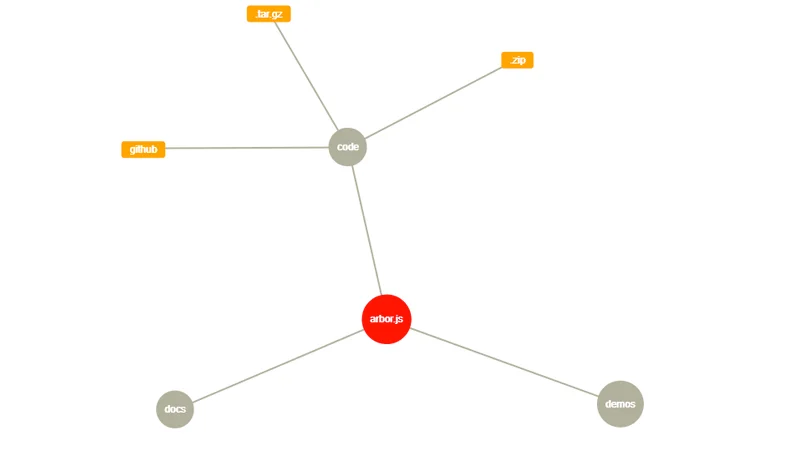
Arbor
Christian Swinehart | January 12, 2011
2464 stars169 watchers
About a code
Arbor is a graph visualization library built with web workers and jQuery. Rather than trying to be an all-encompassing framework, arbor provides an efficient, force-directed layout algorithm plus abstractions for graph organization and screen refresh handling.
It leaves the actual screen-drawing to you. This means you can use it with canvas, SVG, or even positioned HTML elements; whatever display approach is appropriate for your project and your performance needs.
As a result, the code you write with it can be focused on the things that make your project unique – the graph data and your visual style – rather than spending time on the physics math that makes the layouts possible.

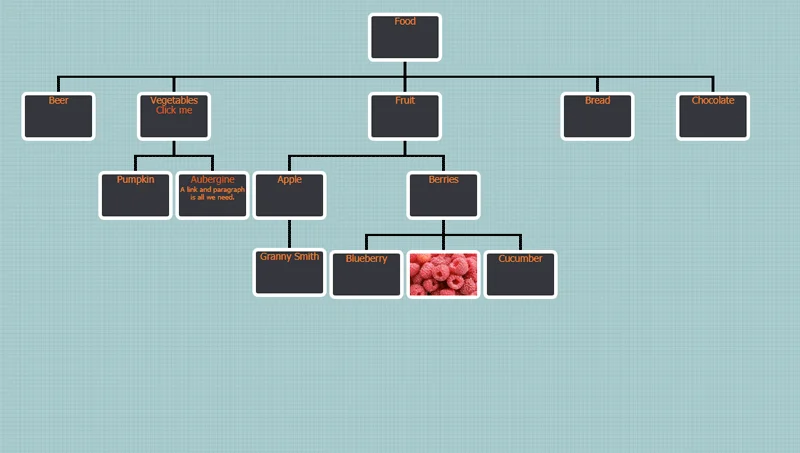
jOrgChart
Wes | November 11, 2011
867 stars106 watchers
About a code
jQuery OrgChart is a plugin that allows you to render structures with nested elements in a easy-to-read tree structure. To build the tree all you need is to make a single line call to the plugin and supply the HTML element Id for a nested unordered list element that is representative of the data you'd like to display. If drag-and-drop is enabled you'll be able to reorder the tree which will also change the underlying list structure.
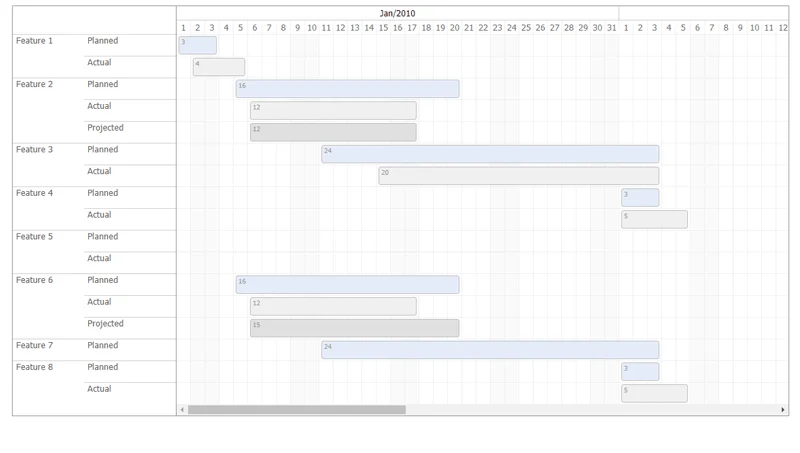
jQuery.ganttView
JC Grubbs | June 9, 2010
640 stars57 watchers
About a code
The jQuery.ganttView plugin is a very lightweight plugin for creating a Gantt chart in plain HTML...no vector graphics or images required. The plugin supports dragging and resizing the Gantt blocks and callbacks to trap the updated data.
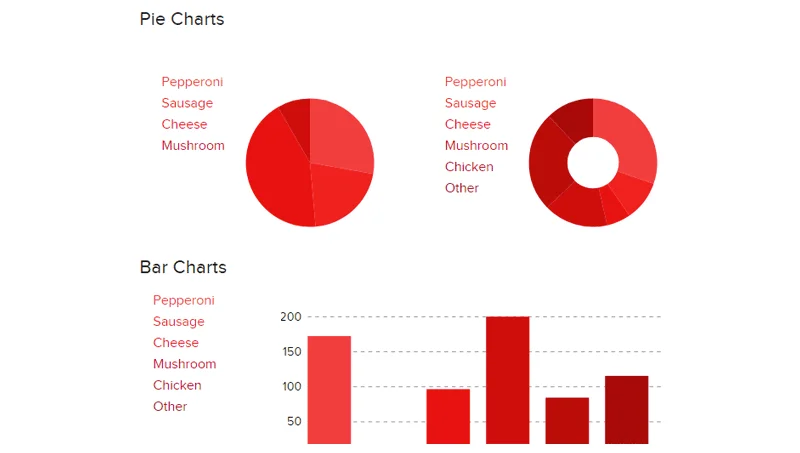
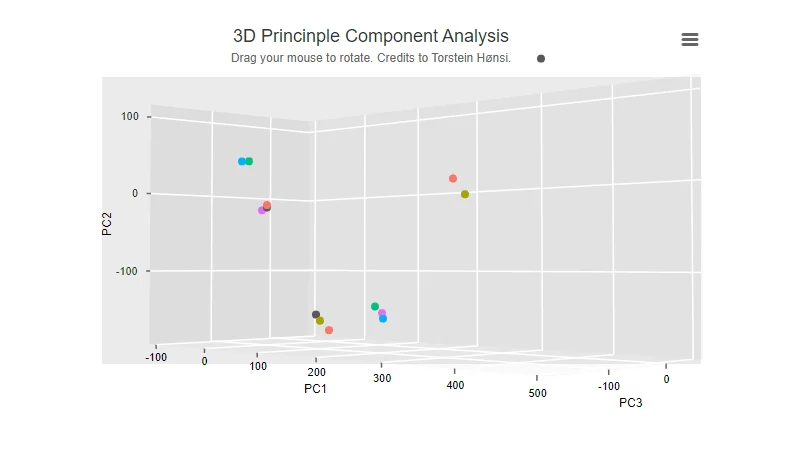
Pizza Pie Charts
Zurb | October 4, 2013
424 stars54 watchers
About a code
Pizza is a responsive pie, donut, bar, and line graph charting library based on the Snap SVG framework from Adobe. It focuses on easy integration via HTML markup and CSS instead of JavaScript objects, although you can pass JavaScript objects to Pizza as well.

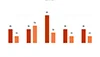
cssCharts.js
About a codejQuery plugin to create simple donut, bar or line charts with dom nodes. Style with CSS.
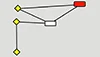
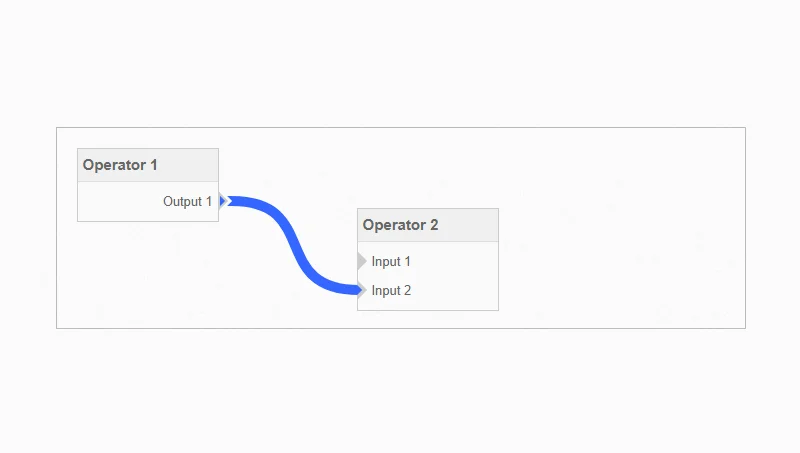
SimpleFlowchart
About a code This is a small JavaScript library with single purpose - draw some nodes and connect them with lines. You can use this library to create your own flow charts or create other similar graphics. Nodes and connection lines can be styled with CSS. Node content can be whatever you want - simple div, image or svg. The library is depends on jQuery and jQuery UI (drag and drop and effects).
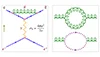
jQuery.Feyn
About a codejQuery.Feyn is a jQuery plugin to facilitate your drawing Feynman diagrams with Scalable Vector Graphics (SVG).
jQuery Spidergraph Plugin
About a codejQuery.spidergraph is a simple module that creates nice looking, interactive spidergraphs in HTML5, using the canvas element.
Discover Our Extensive Snippet Library
This heading suggests that your website provides a wide variety of snippets across different technologies, encouraging users to explore and use these resources for their development projects.
HTML Snippets.
Explore a collection of HTML snippets designed to streamline your web development process. From basic structures to complex elements.
CSS Snippets.
Discover powerful CSS snippets that help you style your web pages with ease. Whether you need layout solutions, animations
JavaScript Snippets.
Enhance your website's interactivity with our JavaScript snippets. From DOM manipulation to advanced algorithms
Bootstrap Snippets.
Leverage the power of Bootstrap with our collection of snippets. Quickly integrate responsive design components
Tailwind Snippets.
Speed up your development process with Tailwind CSS snippets. These utility-first CSS snippets enable you to
jQuery Snippets.
Simplify your JavaScript development with jQuery snippets. Easily perform common tasks like event handling, animations
Let's craft a visual identity that ignites passion and loyalty. ✨